mstree
Calculates TMRCA and the minimum clade proportion for coalescent genealogies
mstree
This Perl program calculates the minimum clade proportion (pmc) and time to the most recent common ancestor (TMRCA) for coalescent genealogies generated with the coalescent simulator ms.
The pmc summary statistic was developed and reported in:
Cox MP, FL Mendez, TM Karafet, M Metni Pilkington, SB Kingan, G Destro-Bisol, BI Strassmann and MF Hammer. 2008. Testing for archaic hominin admixture on the X chromosome: Model likelihoods for the modern human RRM2P4 region from summaries of genealogical topology under the structured coalescent. Genetics 178: 427-437.
Specifically, the code implements equation A1 in the Appendix of Cox et al (2008) for the minimum clade proportion (pmc):
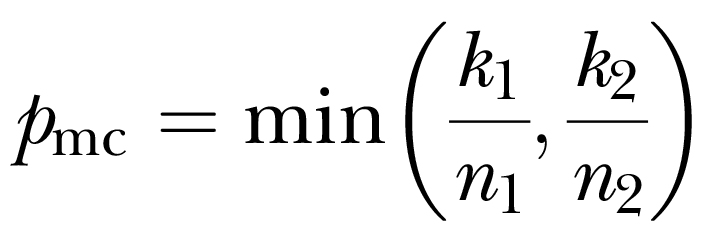
where n1,2 and k1,2 are, respectively, the total number of individuals and number of chromosome copies from a specified group in basal clades 1 and 2.
INSTALLATION
mstree requires a standard working Perl installation and has been confirmed to work with Perl versions up to 5.18.2.
USAGE
Assuming a standard installation (i.e., with mstree.pl aliased to mstree), usage information can be found by running the command:
mstree
The program expects two values: –g1, the number of individuals in the selected group; and –g2, the number of individuals in the non-selected group.
mstree -g1 6 -g2 4
mstree reads coalescent genealogies from Richard Hudson’s ms. Genealogies must be generated in ms using the –T flag, which outputs the coalescent tree in Newick format. Users should also generally apply the –I flag to define at least two populations. mstree assumes that the first n individuals in the ms output belong to the selected group (–g1 n). The user must define input datasets such that this condition holds true.
EXAMPLE
The following command line simulates 3 datasets, each containing 10 chromosome copies, with the first 6 copies deriving from group 1 and the remaining 4 copies from group 2:
ms 10 3 -t 5 -I 2 6 4 1 -T | mstree -g1 6 -g2 4
The coalescent genealogies generated by ms are of course random, but the output formatting looks like the following, with each line containing summaries for a single input dataset:
pmc    tmrca
0.33333    1.691
0.42857    0.903
0.00000    4.653