msrho
Calculates the rho statistic for coalescent genealogies
msrho
This Perl program calculates the ρ (‘rho’) statistic for coalescent genealogies generated with the coalescent simulator ms.
The program was reported in:
Cox MP. 2008. Accuracy of molecular dating with the rho statistic: Deviations from coalescent expectations under a range of demographic models. Human Biology 80: 335-357.
The ρ statistic was developed and described in:
Forster P, R Harding, A Torroni and H-J Bandelt. 1996. Origin and evolution of Native American mtDNA variation: A reappraisal. American Journal of Human Genetics 59: 935-945.
msrho implements equations 2 and 3 in Cox (2008) for the mean and variance of ρ:
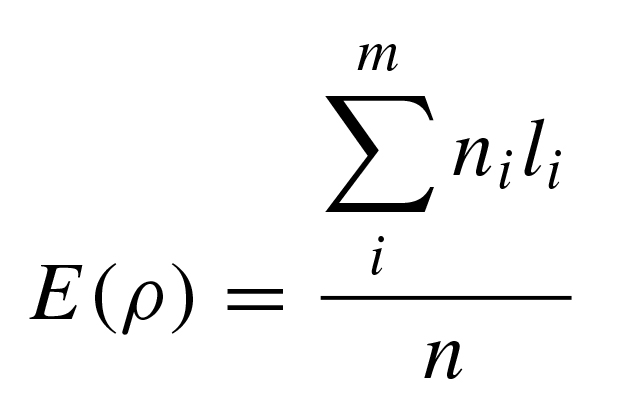
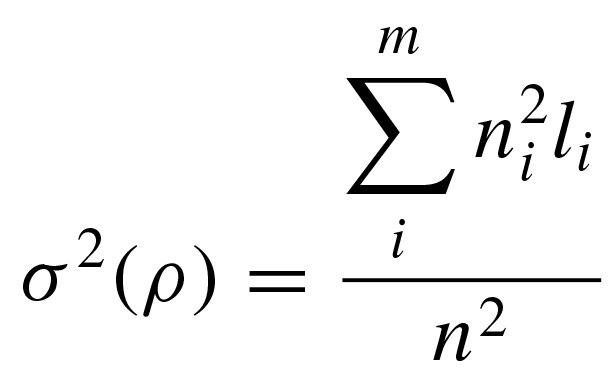
where l is the average number of mutations on m unique lineages sampled from n individuals, with each lineage stemming from a defined ancestral node in a resolved gene tree.
Note: msrho requires a defined ancestor node from which to calculate the ρ statistic. In a simulation setting, the natural node for this purpose is the most recent common ancestor and msrho only calculates ρ for the MRCA.
msrho also calculates the standard deviation of ρ, empirical upper and lower bounds of the 95% confidence interval of ρ, and the number of segregating sites S.
Confidence intervals calculated from the variance are necessarily symmetric about ρ, but this assumes that the number of polymorphisms l are normally distributed. In practice, they usually are not, and empirical confidence intervals inferred from the distribution of l are typically strongly asymmetric.
INSTALLATION
msrho requires a standard working Perl installation and has been confirmed to work with Perl versions up to 5.18.2.
USAGE
The following usage assumes a standard installation (i.e., with msrho.pl aliased to msrho).
msrho reads coalescent genealogies from Richard Hudson’s ms.
EXAMPLE
The following command line simulates 3 datasets, each containing 10 chromosome copies:
ms 10 3 -t 5 | msrho
ms generates random coalescent genealogies, but the output formatting looks like the following, with each line containing summary values for a single input dataset:
S    rho    var    sd    l_95    u_95
30    11    1.76    1.32664991614216    10    12
19    4.6    0.96    0.979795897113271    1    8
12    3.4    0.54    0.734846922834953    1    5