2D_FIR_distribution
Code to calculate 5ʹ and 3ʹ distances to the nearest gene
2D_FIR_distribution
This R script plots 5ʹ and 3ʹ distances to the nearest gene for all genes (the background set) and superimposes 5ʹ and 3ʹ distances to the nearest gene for a subset of genes of interest (e.g., RXLRs or some other category of genes). Points for the subset of genes can be color coded (in this example by expression level).
The code also calculates Monte Carlo statistics to determine whether the intergenic distances of the subset genes differ statistically from the distribution of the background gene set.
DEPENDENCIES
2D_FIR_distribution requires command line access to grep, which will already be installed by default on most UNIX systems, and bedtools, which can be installed easily including through conda. 2D_FIR_distribution was developed with grep v2.6.0-FreeBSD and bedtools v2.30.0, but uses basic functions that should be compatible with most modern versions.
The script also requires the installation of four R packages: GISTools (v0.7-4), grid (v3.6.2), hexbin (v1.28.2) and RColorBrewer (v1.1-2). All R packages can be installed from CRAN simply within R.
INPUTS
2D_FIR_distribution requires four input files: a GFF3 file of all genes in the genome (‘all_gene_file’ – the background gene set); a GFF3 file of the subset of genes being studied (‘subset_gene_file’ – the genes-of-interest gene set); a bedtools genome file that lists each chromosome/scaffold/contig and its size (‘genome_sizes_file’); and a file with gene IDs and percentiles (used for color coding the plotted points). The genome file is straightforward and is explained here. Exemplar files are included in this GitHub distribution.
The script also requires three global variables: a title for the plot (typically the set of genes being analyzed); the maximum intergenic distance to be used for plotting (which allows the exclusion of outliers, if desired); and the number of iterations to be used for the Monte Carlo simulations (typically 105 to 106).
Exemplars for all these inputs are shown in the worked example below.
If preferred, distances can be plotted on a log scale by pre-scaling distances with your desired log function (natural, log10 or log2). An example of this is given in the R code.
USAGE
Program usage, from the UNIX command line, is as follows:
2D_FIR_distribution.R
The script can also be run directly in an R console.
EXAMPLE
2D_FIR_distribution produces two outputs.
First, the probabilities that the median distance to the nearest gene for the subset genes is greater than or less than that expected for the same number of random genes (calculated via a bootstrap with replacement).
Greater than 727.5 : p = 0.0984
Less than 727.5 : p = 0.902
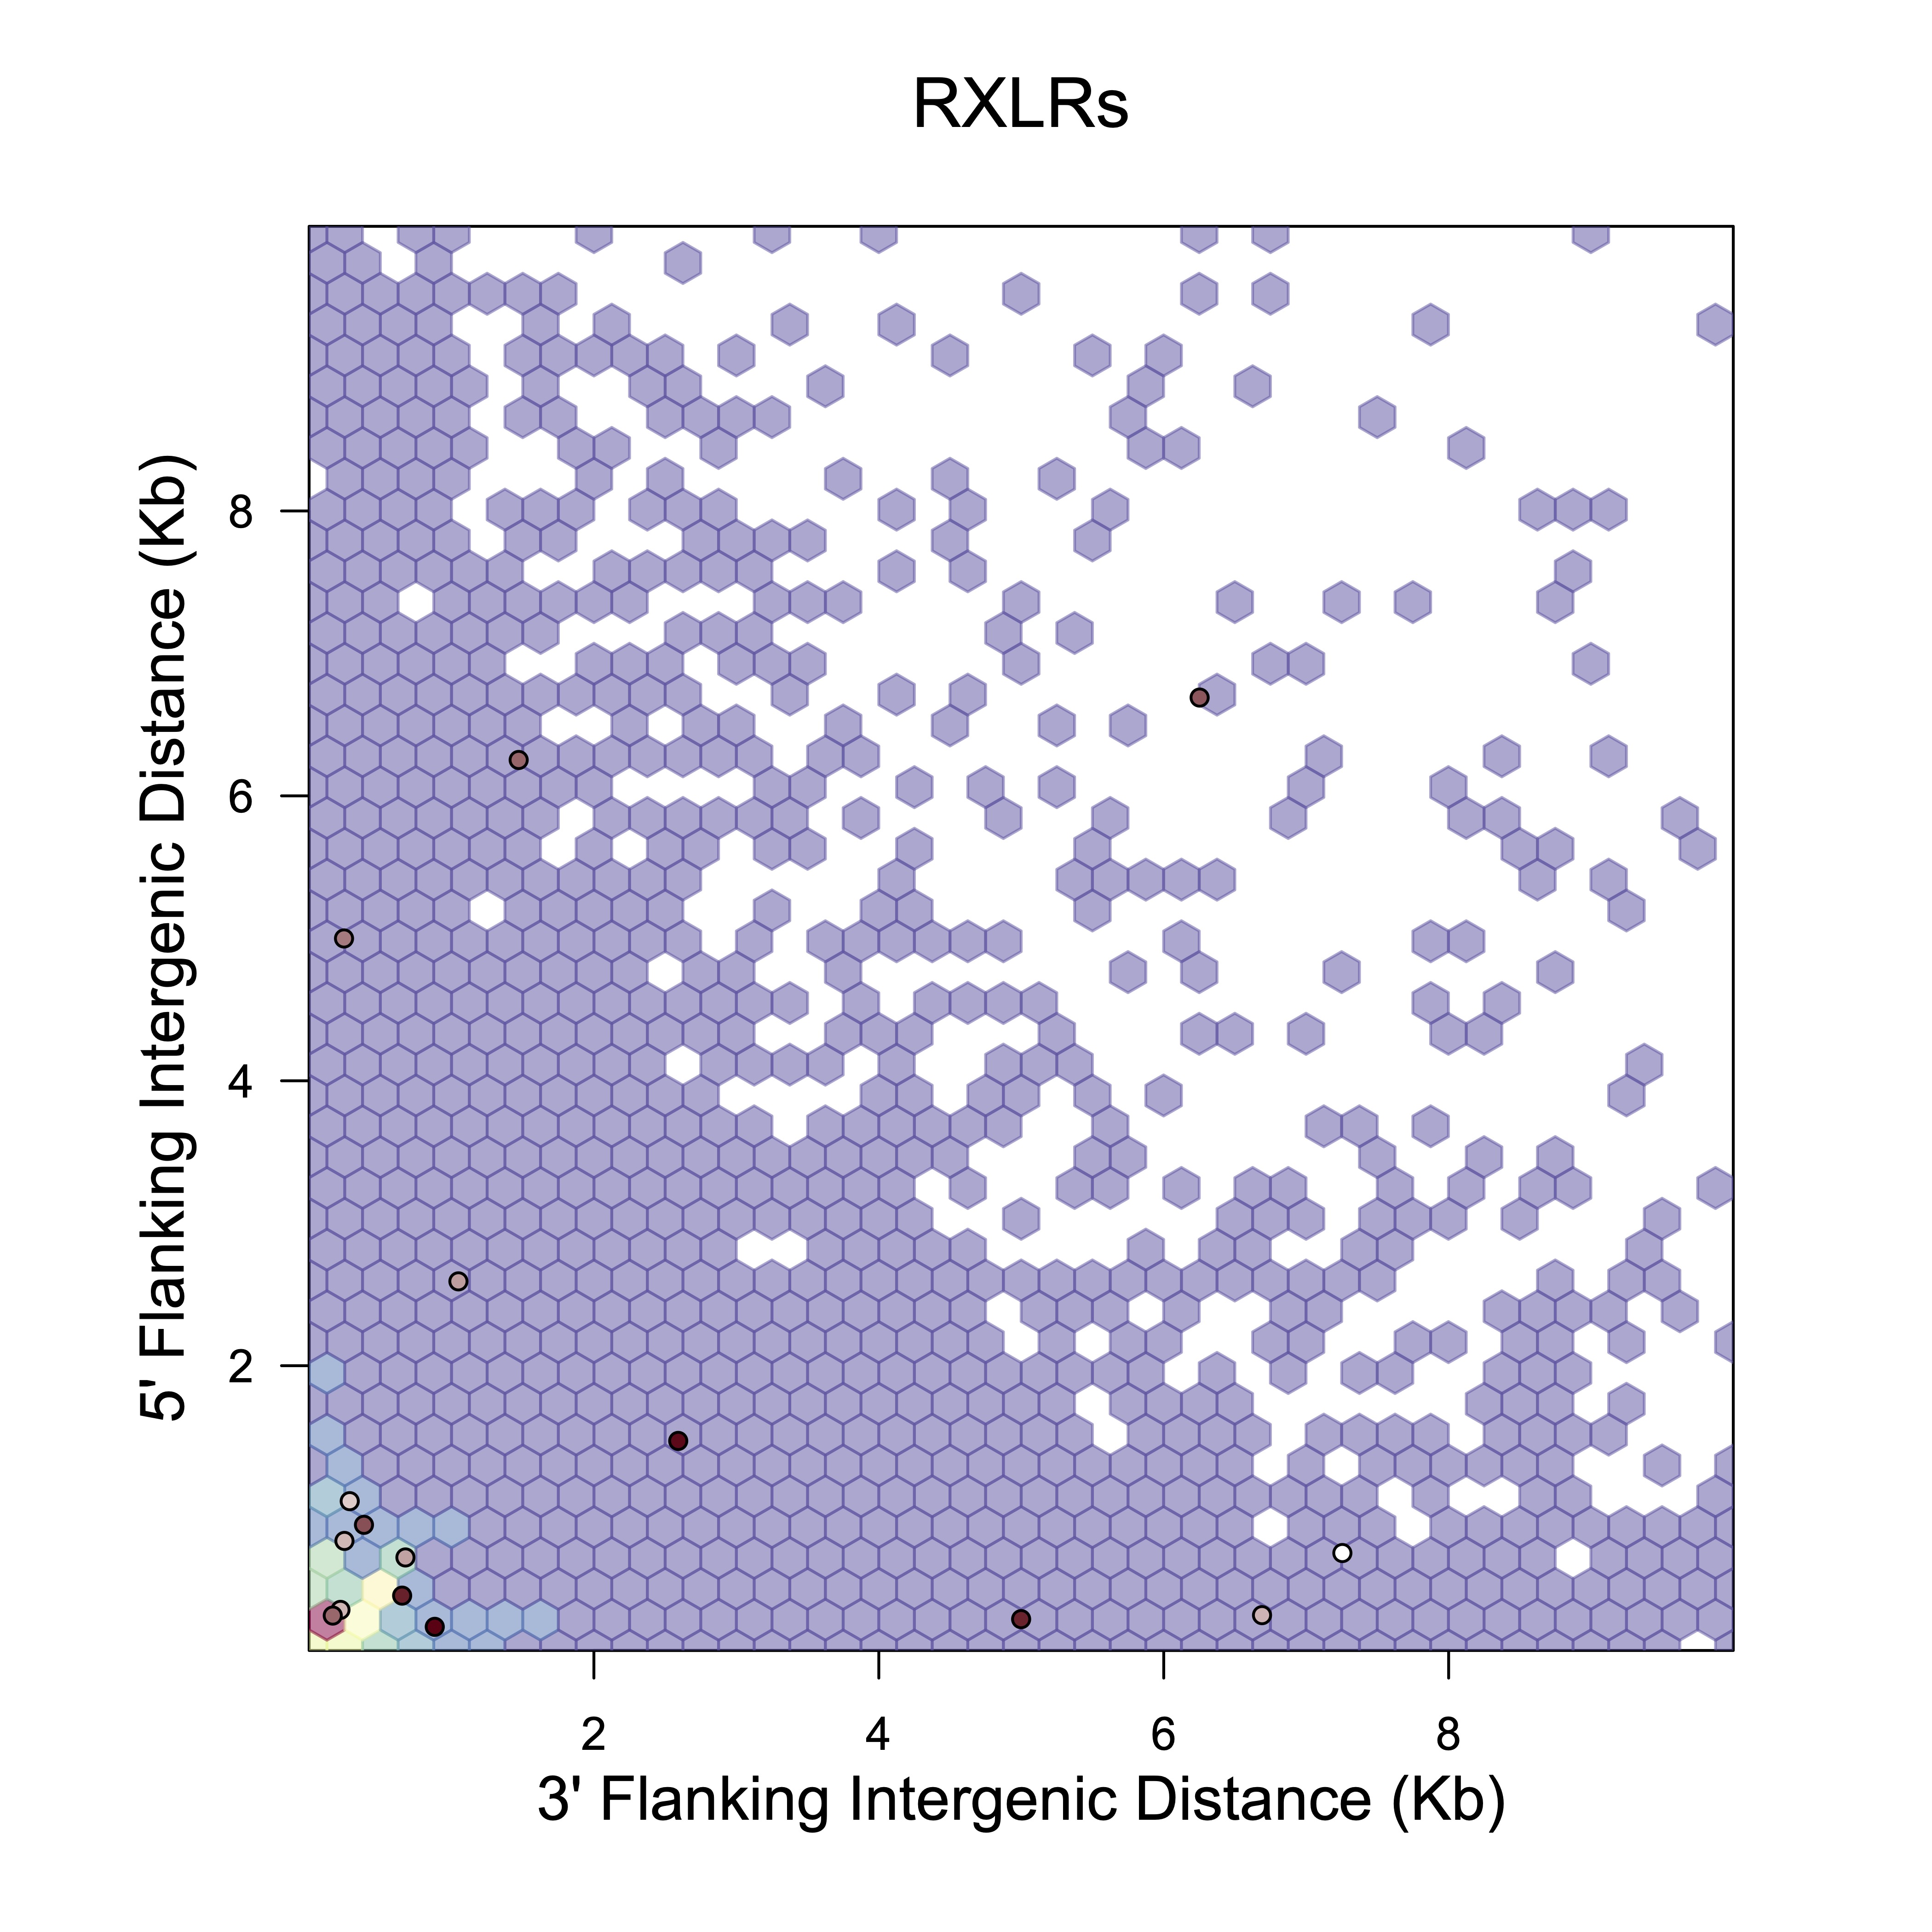
Second, a 2D density plot showing the background distribution of 5ʹ and 3ʹ distances for all genes, with 5ʹ and 3ʹ distances for the subset genes superimposed as points. In this example, the points for the subset genes are colored by the percentile of their expression level, with no expression shown in white, low expression in lighter colors and high expression in darker colors.